Draw treemap
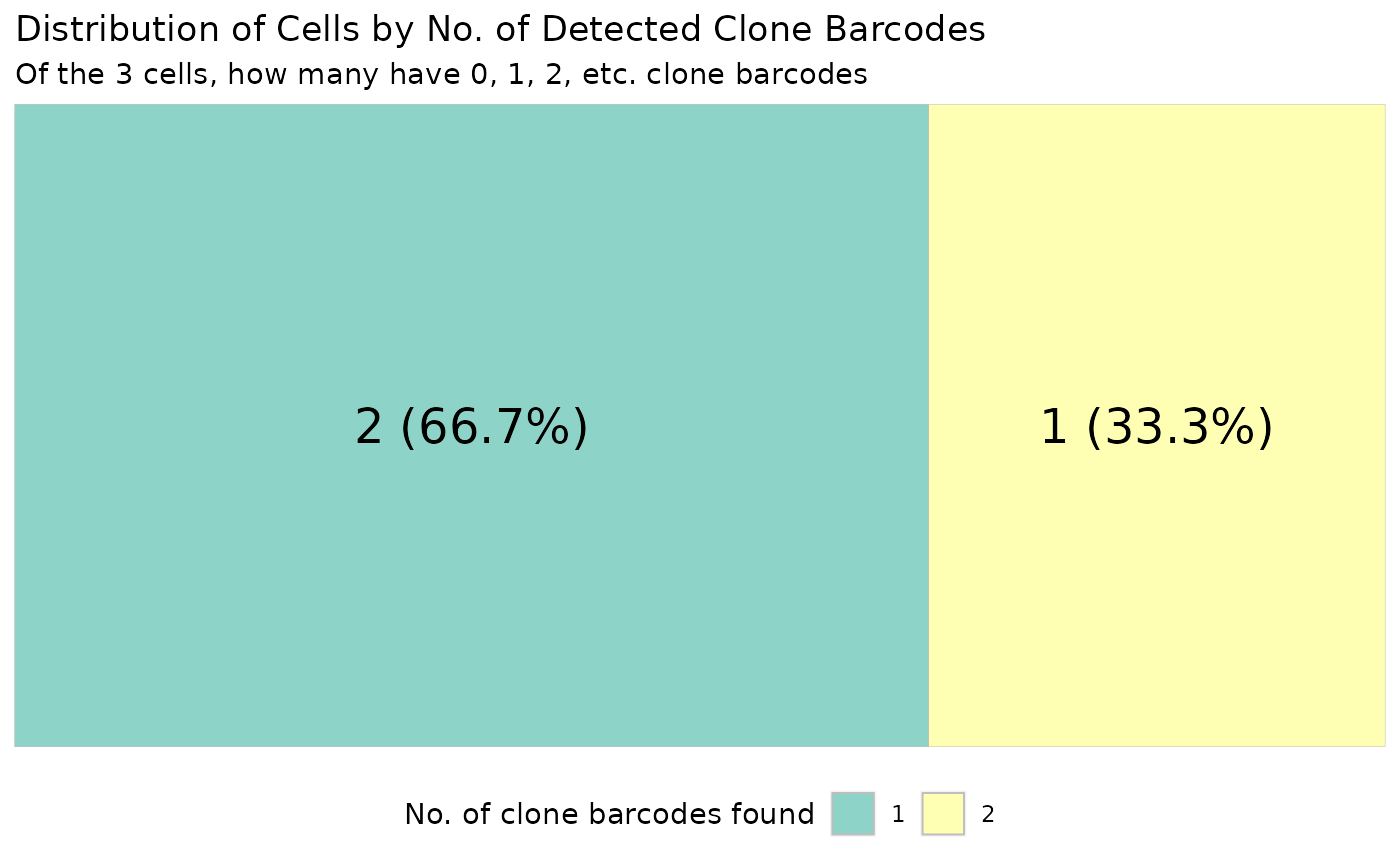
draw_treemap.RdDraw treemap which shows the number and percentage of cells with 0, 1, 2, etc. clone barcodes.
draw_treemap(
  cell_by_clone_matrix,
  valid_cells_bcodes,
  cell_bcode_col = "CellBarcode"
)
Arguments
- cell_by_clone_matrix
A data.table where each row denotes a cell, a clone barcode, and the number of reads assigned to the clone.
- valid_cells_bcodes
A character vector of cell barcodes for droplets deemed real cells. Can be the cell barcodes in cell by gene matrix generated by cellranger's filtered count matrix.
- cell_bcode_col
The column in cell_by_clone_matrix denoting the cell's barcode.
Value
A ggplot object containing the treemap.
Examples
library(data.table)

cell_by_clone_matrix <- data.table(
    CellBarcode = c("A", "B", "C", "C"),
    CloneBarcode = c("AA", "AA", "BB", "CC"),
    n_reads = as.integer(c(2, 2, 2, 1))
)
draw_treemap(
    cell_by_clone_matrix = cell_by_clone_matrix,
    valid_cells_bcodes = c("A", "B", "C")
)
