Interoperability with Seurat
Givanna Putri
Source:vignettes/interoperability_with_seurat.Rmd
interoperability_with_seurat.RmdIntroduction
How can we integrate SuperCellCyto”s output with cytometry data stored in Seurat objects? Is it possible to store the results of SuperCellCyto as Seurat objects for subsequent analysis using Seurat? The answer to both is yes.
In this vignette, we demonstrate this process using a subsampled Levine_32dim dataset used in our manuscript stored in a Seurat object. We will show how to create supercells from this data and analyse them using Seurat.
Preparing Seurat object
We first load the subsampled Levine_32dim data, stored as a qs2
using the qs_read function.
seurat_obj <- qs_read(
    system.file(
        "extdata",
        "Levine_32dim_seurat_sub.qs2",
        package = "SuperCellCyto"
        )
    )
seurat_obj
#> An object of class Seurat
#> 39 features across 1500 samples within 1 assay
#> Active assay: originalexp (39 features, 0 variable features)
#>  1 layer present: counts
The data is stored in the originalexp assay, with both
counts and data slots containing raw data.
Before running SuperCellCyto, we will first:
- Subset this data to retain only the markers we need to perform downstream analysis.
- Perform arcsinh transformation, and store the transformed data in
the
dataslot of theoriginalexpassay.
markers <- c(
    "CD45RA", "CD133", "CD19", "CD22", "CD11b", "CD4", "CD8", "CD34",
    "Flt3", "CD20", "CXCR4", "CD235ab", "CD45", "CD123", "CD321", "CD14",
    "CD33", "CD47", "CD11c", "CD7", "CD15", "CD16", "CD44", "CD38", "CD13",
    "CD3", "CD61", "CD117", "CD49d", "HLA-DR", "CD64", "CD41"
)

# keep only the relevant markers
seurat_obj <- seurat_obj[markers, ]

# to store arcsinh transformed data
seurat_obj[["originalexp"]]$data <- asinh(
    seurat_obj[["originalexp"]]$counts / 5
)

seurat_obj
#> An object of class Seurat
#> 32 features across 1500 samples within 1 assay
#> Active assay: originalexp (32 features, 0 variable features)
#>  2 layers present: counts, data
Run SuperCellCyto
SuperCellCyto requires the input data in a data.table
format. Hence, we will extract the arcsinh-transformed data from the
Seurat object, format it into a data.table, and include sample
information and cell IDs.
It”s important to note that Seurat objects typically store cells as columns and features (markers or genes) as rows. Since SuperCellCyto expects cells as rows and features as columns, we will also transpose the data.
After transposing and preparing the data table, we run
runSuperCellCyto function, passing the required parameters
including the markers, sample column name, cell ID column name, and
gamma value.
# check.names set to FALSE so HLA-DR is not replaced with HLA.DR
dt <- data.table(
    t(data.frame(seurat_obj[["originalexp"]]$data, check.names = FALSE))
)
# add the cell_id and sample metadata
dt <- cbind(dt, seurat_obj[[c("cell_id", "sample")]])

supercells <- runSuperCellCyto(
    dt = dt,
    markers = markers,
    sample_colname = "sample",
    cell_id_colname = "cell_id",
    gam = 5
)

head(supercells$supercell_expression_matrix)
#>       CD45RA     CD133       CD19        CD22     CD11b        CD4          CD8
#>        <num>     <num>      <num>       <num>     <num>      <num>        <num>
#> 1: 0.7567786 0.2094107 0.07620974 0.009254529 0.3511375 0.78500942 0.8687925975
#> 2: 1.1482748 0.6268151 0.40876592 0.091766210 0.2766514 0.09603202 1.3321355589
#> 3: 0.1700757 0.1339944 0.07228738 0.101802043 0.1040339 0.18761509 0.1132434207
#> 4: 0.8968968 0.2921571 2.22313786 0.450342888 0.4193913 0.23917011 0.1332567931
#> 5: 0.1476499 0.1904578 0.11589638 0.106288009 0.2489399 0.52420384 0.4813924176
#> 6: 0.3801373 0.2772991 0.68028804 0.237641653 0.2007602 0.04097948 0.0001923242
#>          CD34      Flt3        CD20     CXCR4   CD235ab     CD45        CD123
#>         <num>     <num>       <num>     <num>     <num>    <num>        <num>
#> 1: 0.11526045 0.5488327 0.041534679 1.2172962 0.6303494 5.788989  0.070171026
#> 2: 0.12708141 0.0793773 0.053358629 0.3920845 0.5637494 5.785661  0.084488379
#> 3: 3.23152402 0.1749861 0.008712508 0.5421237 0.1212147 3.416994  0.066197760
#> 4: 0.30587619 0.5787963 0.136006539 1.3302008 0.3211722 4.369223  0.698444542
#> 5: 0.05301752 0.3468969 0.092965825 0.2609136 0.5636011 5.684187 -0.003512615
#> 6: 2.13054119 0.1427986 0.005927587 0.5651623 0.1386637 3.051677  0.143230069
#>       CD321       CD14       CD33     CD47     CD11c        CD7      CD15
#>       <num>      <num>      <num>    <num>     <num>      <num>     <num>
#> 1: 1.500236 0.04154518 0.06746186 3.221072 0.2123768 2.28170702 0.2050279
#> 2: 1.656612 0.08216914 0.12675445 2.043989 0.1105668 2.43975076 0.2104722
#> 3: 2.803258 0.02104697 0.17107591 2.657387 0.3190474 0.03814356 0.2649500
#> 4: 2.654545 0.01727268 0.24770161 4.576991 0.4200163 0.09815344 0.3564437
#> 5: 1.466286 0.08933425 0.02555677 2.352106 0.1591512 2.55868425 0.1185639
#> 6: 2.040685 0.09609030 0.35279157 3.578527 0.2416795 0.02281908 0.5117449
#>          CD16     CD44      CD38       CD13        CD3       CD61       CD117
#>         <num>    <num>     <num>      <num>      <num>      <num>       <num>
#> 1: 0.03168278 2.925953 0.6649237 0.09905437 5.10948135 0.05358984 0.281380801
#> 2: 0.10139879 4.354774 1.1550810 0.22855225 0.58614888 0.16057716 0.003634178
#> 3: 0.04358262 2.895200 0.9998574 0.31835180 0.15497706 0.05665786 0.993750340
#> 4: 0.35695241 5.021503 6.2330245 0.64945662 0.17109374 0.18993344 0.082566733
#> 5: 0.08155028 2.924965 0.3143248 0.09534336 4.89098214 0.22921411 0.059164421
#> 6: 0.06652319 2.830727 3.7236044 0.71869068 0.09991223 0.28525846 0.111576001
#>        CD49d    HLA-DR       CD64       CD41 sample           SuperCellId
#>        <num>     <num>      <num>      <num> <char>                <char>
#> 1: 0.3529696 0.1407416 0.09377686 0.07614376     H1 SuperCell_1_Sample_H1
#> 2: 0.8440716 0.2467888 0.18515576 0.28544083     H1 SuperCell_2_Sample_H1
#> 3: 1.0233080 1.6318626 0.25253230 0.04277276     H1 SuperCell_3_Sample_H1
#> 4: 1.5830615 0.0820442 0.03792944 0.16956875     H1 SuperCell_4_Sample_H1
#> 5: 0.3508159 0.1748238 0.11055986 0.04522353     H1 SuperCell_5_Sample_H1
#> 6: 1.6866826 3.0233062 0.13634514 0.40852578     H1 SuperCell_6_Sample_H1
We can now embed the supercell ID in the metadata of our Seurat object.
seurat_obj$supercell_id <- factor(supercells$supercell_cell_map$SuperCellID)
head(seurat_obj[[]])
#>        orig.ident nCount_originalexp nFeature_originalexp population_id sample
#> Cell_1       Cell           782.3311                   23     Basophils     H1
#> Cell_2       Cell           849.1107                   28     Basophils     H1
#> Cell_3       Cell          1349.6991                   21     Basophils     H1
#> Cell_4       Cell           908.6923                   23     Basophils     H1
#> Cell_5       Cell           723.2195                   27     Basophils     H1
#> Cell_6       Cell           444.4285                   22     Basophils     H1
#>        cell_id            supercell_id
#> Cell_1  cell_1  SuperCell_22_Sample_H1
#> Cell_2  cell_2  SuperCell_50_Sample_H1
#> Cell_3  cell_3  SuperCell_28_Sample_H1
#> Cell_4  cell_4 SuperCell_141_Sample_H1
#> Cell_5  cell_5 SuperCell_141_Sample_H1
#> Cell_6  cell_6  SuperCell_99_Sample_H1
Analyse Supercells as Seurat object
The supercell expression matrix, having fewer supercells than the number of cells in the Seurat object, is best stored as a separate Seurat object. This allows us to use Seurat”s functions for analysis.
To do this, we first transpose the expression matrix, ensuring cells
are columns and markers are rows, and then create a new Seurat object
with the default RNA assay. The data and
counts slots of the RNA assay are then set to contain the
marker expression.
supercell_mat <- t(
    supercells$supercell_expression_matrix[, markers, with = FALSE]
)
colnames(supercell_mat) <- supercells$supercell_expression_matrix$SuperCellId
supercell_seurat_obj <- CreateSeuratObject(counts = supercell_mat)
#> Warning: Data is of class matrix. Coercing to dgCMatrix.
supercell_seurat_obj[["RNA"]]$data <- supercell_seurat_obj[["RNA"]]$counts

supercell_seurat_obj
#> An object of class Seurat
#> 32 features across 300 samples within 1 assay
#> Active assay: RNA (32 features, 0 variable features)
#>  2 layers present: counts, data
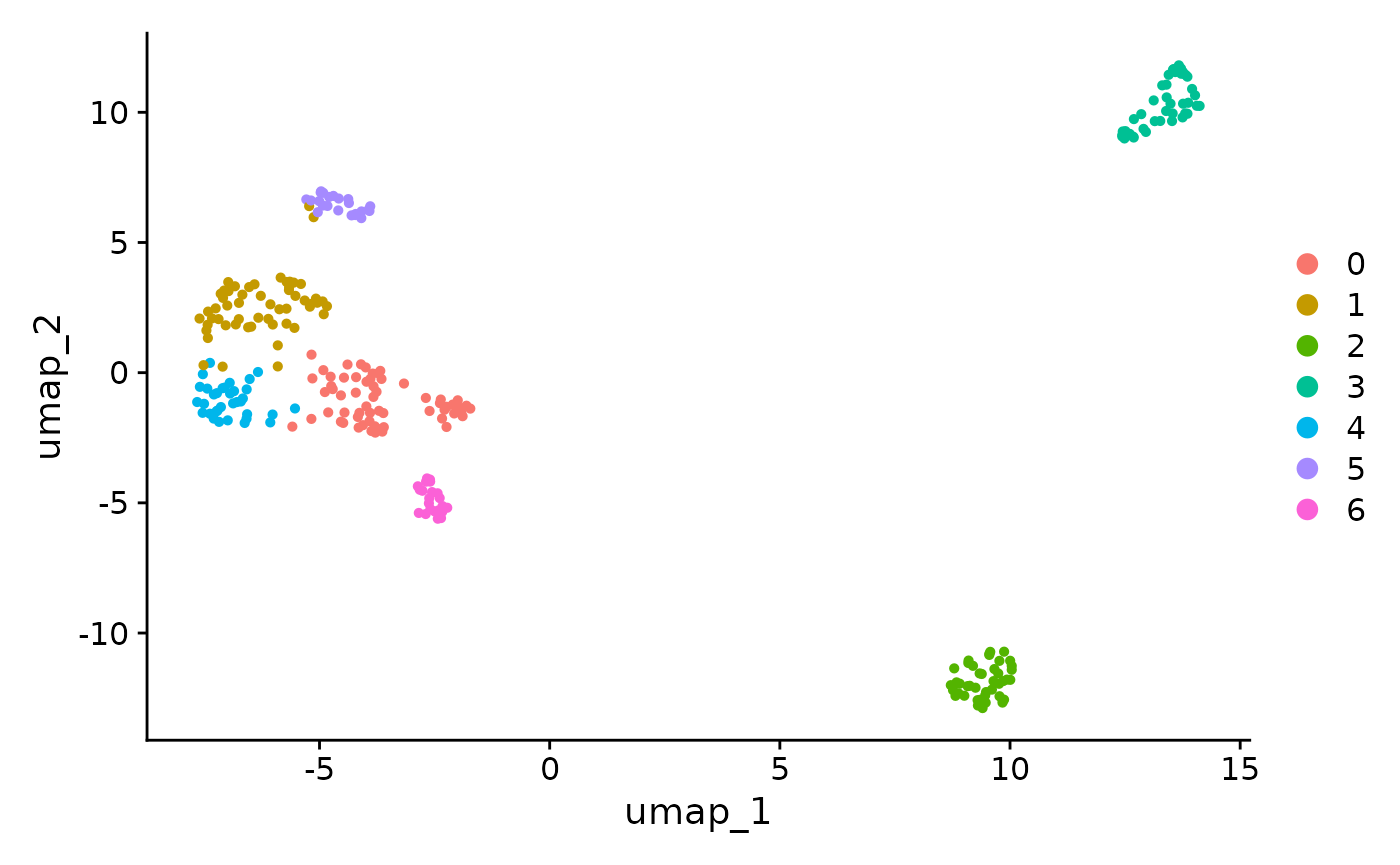
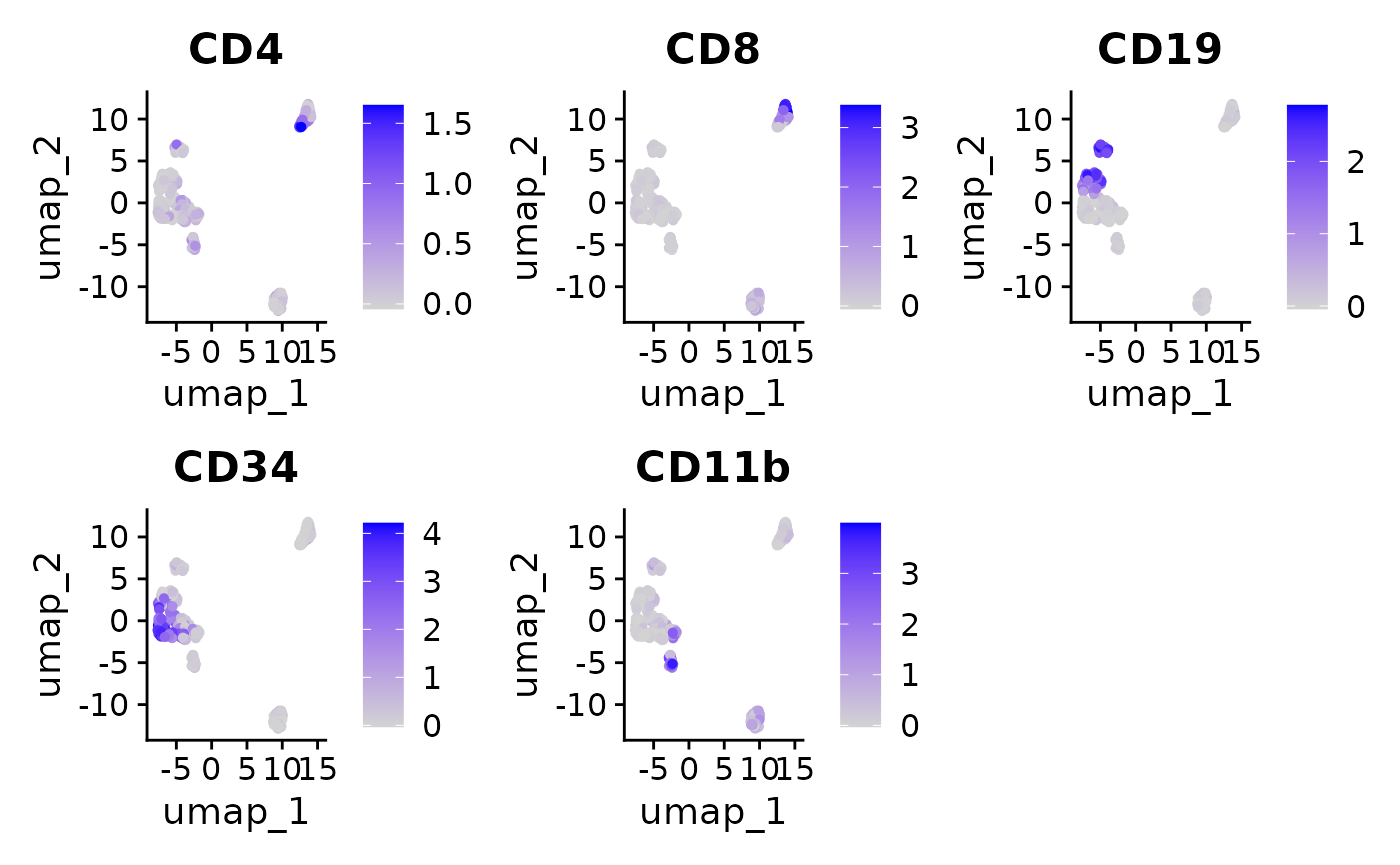
With the supercell marker expression stored as a Seurat object, we can proceed with performing downstream analysis such as clustering and creating UMAP plots.
# Have to do this, otherwise Seurat will complain
supercell_seurat_obj <- ScaleData(supercell_seurat_obj)

supercell_seurat_obj <- RunPCA(
    object = supercell_seurat_obj,
    npcs = 10,
    nfeatures.print = 1,
    approx = FALSE,
    seed.use = 42,
    features = markers
)

supercell_seurat_obj <- FindNeighbors(supercell_seurat_obj, dims = 1:10)
supercell_seurat_obj <- FindClusters(supercell_seurat_obj, resolution = 0.5)
#> Modularity Optimizer version 1.3.0 by Ludo Waltman and Nees Jan van Eck
#>
#> Number of nodes: 300
#> Number of edges: 6654
#>
#> Running Louvain algorithm...
#> Maximum modularity in 10 random starts: 0.8756
#> Number of communities: 7
#> Elapsed time: 0 seconds
supercell_seurat_obj <- RunUMAP(supercell_seurat_obj, dims = 1:10)
#> Warning: The default method for RunUMAP has changed from calling Python UMAP via reticulate to the R-native UWOT using the cosine metric
#> To use Python UMAP via reticulate, set umap.method to 'umap-learn' and metric to 'correlation'
#> This message will be shown once per session

DimPlot(supercell_seurat_obj, reduction = "umap")
#> Warning: `aes_string()` was deprecated in ggplot2 3.0.0.
#> ℹ Please use tidy evaluation idioms with `aes()`.
#> ℹ See also `vignette("ggplot2-in-packages")` for more information.
#> ℹ The deprecated feature was likely used in the Seurat package.
#>   Please report the issue at <https://github.com/satijalab/seurat/issues>.
#> This warning is displayed once every 8 hours.
#> Call `lifecycle::last_lifecycle_warnings()` to see where this warning was
#> generated.
FeaturePlot(
    supercell_seurat_obj,
    features = c("CD4", "CD8", "CD19", "CD34", "CD11b"), ncol = 3
)
#> Warning: The `slot` argument of `FetchData()` is deprecated as of SeuratObject 5.0.0.
#> ℹ Please use the `layer` argument instead.
#> ℹ The deprecated feature was likely used in the Seurat package.
#>   Please report the issue at <https://github.com/satijalab/seurat/issues>.
#> This warning is displayed once every 8 hours.
#> Call `lifecycle::last_lifecycle_warnings()` to see where this warning was
#> generated.
Transfer information from supercells to single-cell Seurat object
To transfer information (e.g., clusters) obtained from analyzing supercells back to the single cells, we need to do some data wrangling. The key is ensuring the order of the new information aligns with the order of cells in the Seurat object.
We demonstrate this using cluster information as an example. We first
extract the metadata from the single-cell Seurat object and clustering
information from the supercells Seurat object into two different
data.table objects. We then merge them using
merge.data.table, setting the sort parameter
to FALSE and x parameter to the data.table
containing the metadata from the single-cell Seurat object. These ensure
the result is in the order of the metadata from our single-cell Seurat
object.
clusters <- data.table(
    supercell_id = colnames(supercell_seurat_obj),
    cluster = as.vector(Idents(supercell_seurat_obj))
)

cell_metadata <- seurat_obj[[]]
cell_metadata <- merge.data.table(
    x = cell_metadata,
    y = clusters,
    by = "supercell_id",
    sort = FALSE
)
After merging, we can add the cluster assignment to the metadata of the single-cell Seurat object.
seurat_obj$cluster <- cell_metadata$cluster
Idents(seurat_obj) <- "cluster"
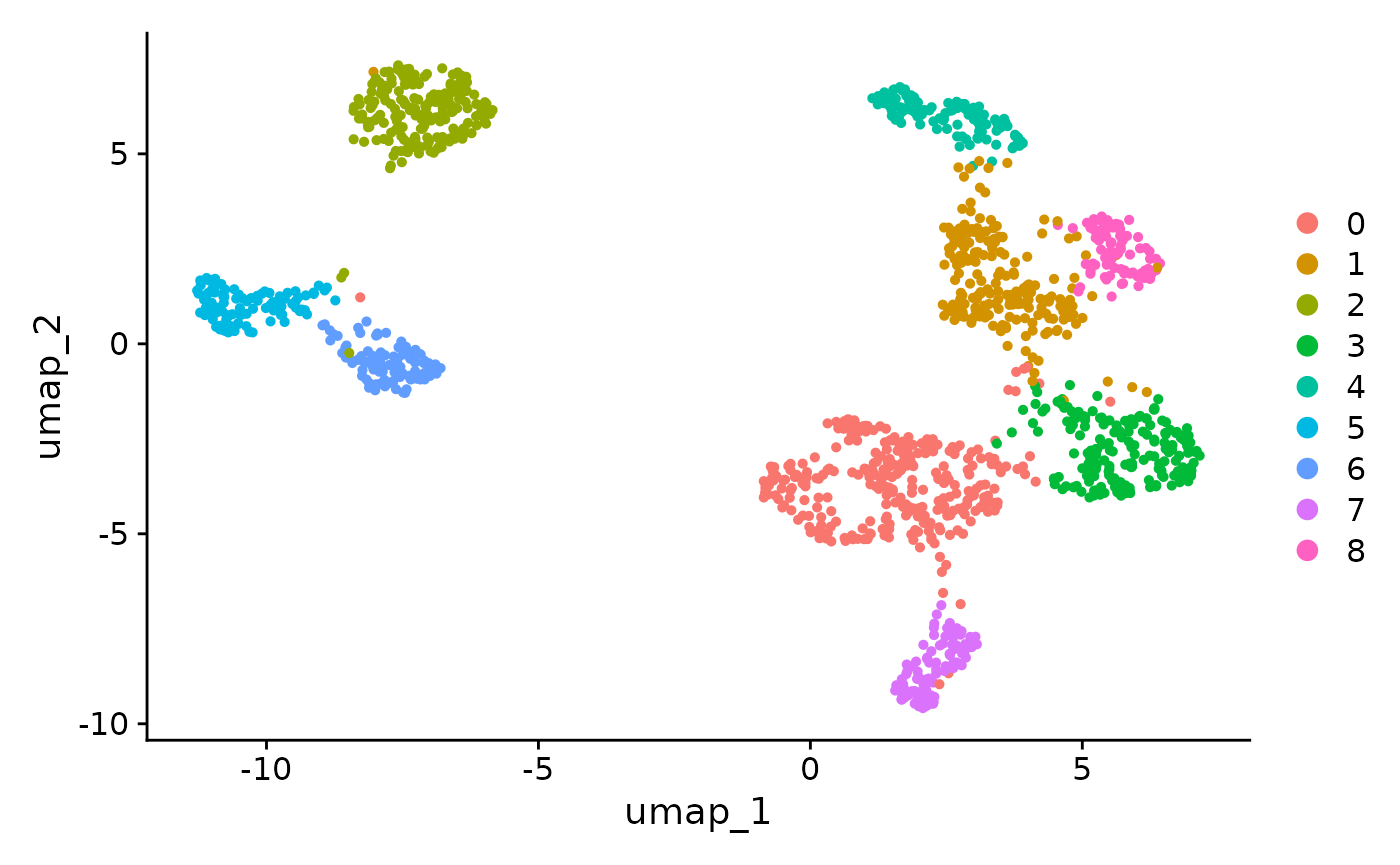
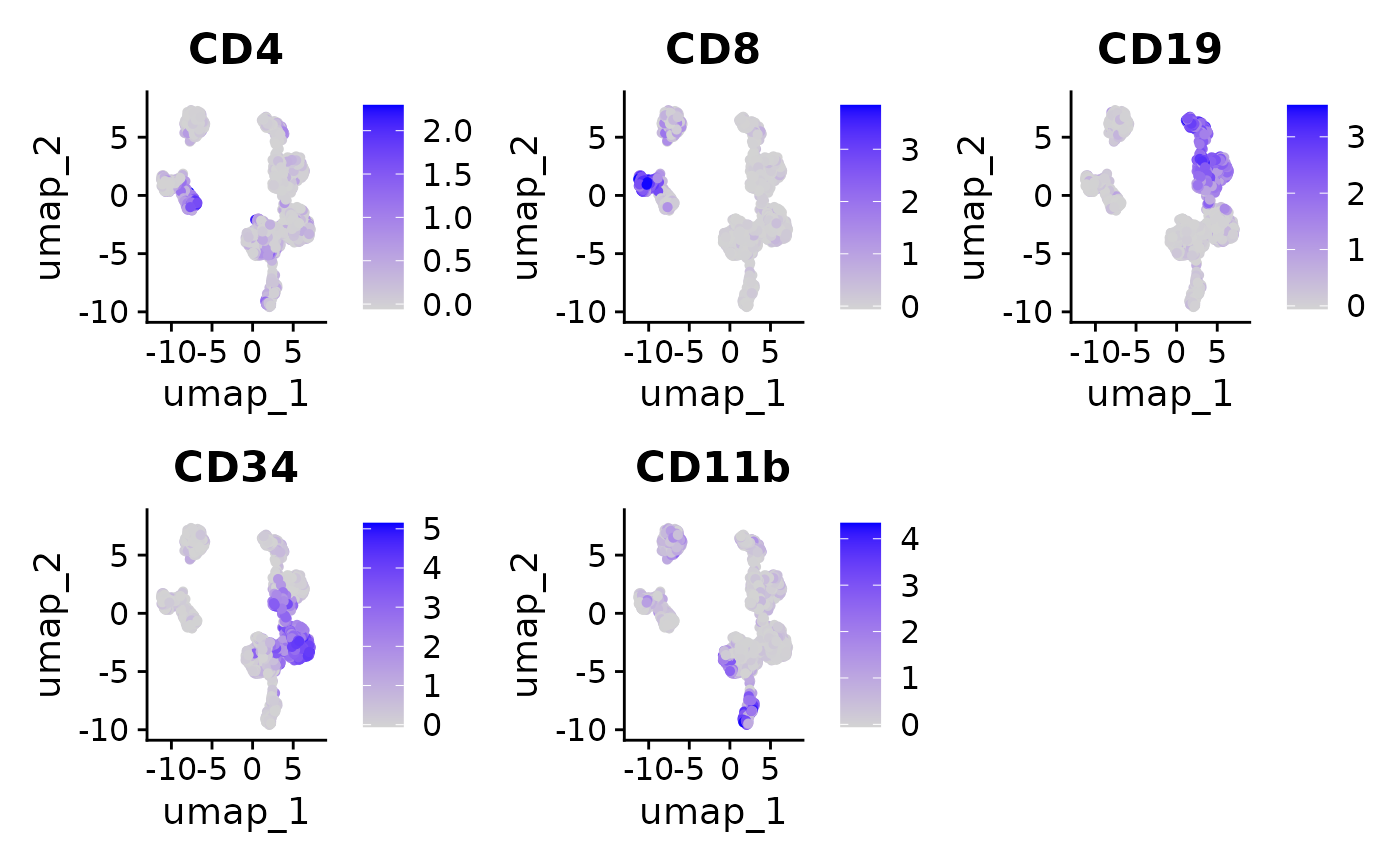
Then visualise the cluster assignments and marker expressions of our clustered single cell data.
seurat_obj <- ScaleData(seurat_obj)
seurat_obj <- RunPCA(
    object = seurat_obj,
    npcs = 10,
    nfeatures.print = 1,
    approx = FALSE,
    seed.use = 42,
    features = markers
)

seurat_obj <- FindNeighbors(seurat_obj, dims = 1:10)
seurat_obj <- FindClusters(seurat_obj, resolution = 0.5)
#> Modularity Optimizer version 1.3.0 by Ludo Waltman and Nees Jan van Eck
#>
#> Number of nodes: 1500
#> Number of edges: 49470
#>
#> Running Louvain algorithm...
#> Maximum modularity in 10 random starts: 0.9073
#> Number of communities: 8
#> Elapsed time: 0 seconds
seurat_obj <- RunUMAP(seurat_obj, dims = 1:10)

DimPlot(seurat_obj, reduction = "umap")
FeaturePlot(
    seurat_obj,
    features = c("CD4", "CD8", "CD19", "CD34", "CD11b"), ncol = 3
)
Session information
sessionInfo()
#> R version 4.5.1 (2025-06-13)
#> Platform: x86_64-pc-linux-gnu
#> Running under: Ubuntu 24.04.3 LTS
#>
#> Matrix products: default
#> BLAS:   /usr/lib/x86_64-linux-gnu/openblas-pthread/libblas.so.3
#> LAPACK: /usr/lib/x86_64-linux-gnu/openblas-pthread/libopenblasp-r0.3.26.so;  LAPACK version 3.12.0
#>
#> locale:
#>  [1] LC_CTYPE=C.UTF-8       LC_NUMERIC=C           LC_TIME=C.UTF-8
#>  [4] LC_COLLATE=C.UTF-8     LC_MONETARY=C.UTF-8    LC_MESSAGES=C.UTF-8
#>  [7] LC_PAPER=C.UTF-8       LC_NAME=C              LC_ADDRESS=C
#> [10] LC_TELEPHONE=C         LC_MEASUREMENT=C.UTF-8 LC_IDENTIFICATION=C
#>
#> time zone: UTC
#> tzcode source: system (glibc)
#>
#> attached base packages:
#> [1] stats     graphics  grDevices utils     datasets  methods   base
#>
#> other attached packages:
#> [1] future_1.67.0        SuperCellCyto_0.99.3 data.table_1.17.8
#> [4] Seurat_5.3.0         SeuratObject_5.2.0   sp_2.2-0
#> [7] qs2_0.1.5            BiocStyle_2.36.0
#>
#> loaded via a namespace (and not attached):
#>   [1] RColorBrewer_1.1-3     jsonlite_2.0.0         magrittr_2.0.4
#>   [4] spatstat.utils_3.2-0   farver_2.1.2           rmarkdown_2.30
#>   [7] fs_1.6.6               ragg_1.5.0             vctrs_0.6.5
#>  [10] ROCR_1.0-11            spatstat.explore_3.5-3 htmltools_0.5.8.1
#>  [13] sass_0.4.10            sctransform_0.4.2      parallelly_1.45.1
#>  [16] KernSmooth_2.23-26     bslib_0.9.0            htmlwidgets_1.6.4
#>  [19] desc_1.4.3             ica_1.0-3              plyr_1.8.9
#>  [22] plotly_4.11.0          zoo_1.8-14             cachem_1.1.0
#>  [25] igraph_2.1.4           mime_0.13              lifecycle_1.0.4
#>  [28] pkgconfig_2.0.3        Matrix_1.7-3           R6_2.6.1
#>  [31] fastmap_1.2.0          fitdistrplus_1.2-4     shiny_1.11.1
#>  [34] digest_0.6.37          patchwork_1.3.2        tensor_1.5.1
#>  [37] RSpectra_0.16-2        irlba_2.3.5.1          textshaping_1.0.4
#>  [40] labeling_0.4.3         progressr_0.16.0       spatstat.sparse_3.1-0
#>  [43] httr_1.4.7             polyclip_1.10-7        abind_1.4-8
#>  [46] compiler_4.5.1         withr_3.0.2            S7_0.2.0
#>  [49] BiocParallel_1.42.2    fastDummies_1.7.5      MASS_7.3-65
#>  [52] tools_4.5.1            lmtest_0.9-40          httpuv_1.6.16
#>  [55] future.apply_1.20.0    goftest_1.2-3          glue_1.8.0
#>  [58] nlme_3.1-168           promises_1.3.3         grid_4.5.1
#>  [61] Rtsne_0.17             cluster_2.1.8.1        reshape2_1.4.4
#>  [64] generics_0.1.4         gtable_0.3.6           spatstat.data_3.1-8
#>  [67] tidyr_1.3.1            stringfish_0.17.0      spatstat.geom_3.6-0
#>  [70] RcppAnnoy_0.0.22       ggrepel_0.9.6          RANN_2.6.2
#>  [73] pillar_1.11.1          stringr_1.5.2          spam_2.11-1
#>  [76] RcppHNSW_0.6.0         later_1.4.4            splines_4.5.1
#>  [79] dplyr_1.1.4            lattice_0.22-7         survival_3.8-3
#>  [82] deldir_2.0-4           tidyselect_1.2.1       miniUI_0.1.2
#>  [85] pbapply_1.7-4          knitr_1.50             gridExtra_2.3
#>  [88] bookdown_0.45          scattermore_1.2        xfun_0.53
#>  [91] matrixStats_1.5.0      stringi_1.8.7          lazyeval_0.2.2
#>  [94] yaml_2.3.10            evaluate_1.0.5         codetools_0.2-20
#>  [97] SuperCell_1.0.1        tibble_3.3.0           BiocManager_1.30.26
#> [100] cli_3.6.5              uwot_0.2.3             RcppParallel_5.1.11-1
#> [103] xtable_1.8-4           reticulate_1.43.0      systemfonts_1.3.1
#> [106] jquerylib_0.1.4        Rcpp_1.1.0             globals_0.18.0
#> [109] spatstat.random_3.4-2  png_0.1-8              spatstat.univar_3.1-4
#> [112] parallel_4.5.1         pkgdown_2.1.3          ggplot2_4.0.0
#> [115] dotCall64_1.2          listenv_0.9.1          viridisLite_0.4.2
#> [118] scales_1.4.0           ggridges_0.5.7         crayon_1.5.3
#> [121] purrr_1.1.0            rlang_1.1.6            cowplot_1.2.0